
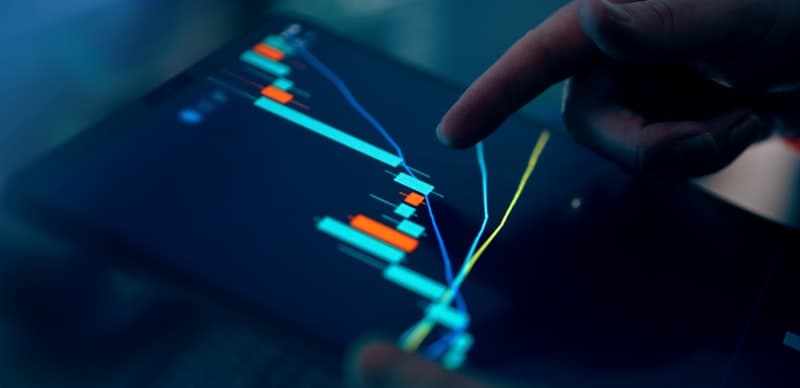
Divergence is one of the most reliable signals in technical analysis, especially when you trade volatile assets like Bitcoin (BTC/USD) or Ethereum (ETH/USD). While many traders know the classic “regular” divergence, hidden divergence often gets overlooked despite its ability to reveal continuation moves. This article breaks down the mechanics of both types, shows you how to spot them on crypto charts, and provides a step‑by‑step trading strategy that works on personal accounts and on a Global4EX funded account.
In simple terms, divergence occurs when price action and an oscillator (most commonly the Relative Strength Index – RSI, or the Moving Average Convergence Divergence – MACD) move in opposite directions. The mismatch signals that the underlying momentum is weakening (regular divergence) or that the momentum is still strong despite a price pullback (hidden divergence). Because oscillators are bounded between fixed levels, they often reveal hidden strength or weakness before price does.
Regular divergence is a reversal signal. It appears when price makes a higher high (HH) while the oscillator makes a lower high (LH) – a bearish regular divergence – or when price makes a lower low (LL) while the oscillator makes a higher low (HL) – a bullish regular divergence. In crypto markets, this pattern frequently shows up on the 4‑hour and daily timeframes, where swing moves are large enough to generate clear highs and lows.
Key points for regular divergence
Hidden divergence is a continuation signal. It occurs when price makes a higher low (HL) but the oscillator makes a lower low (LL) – a bullish hidden divergence – or when price makes a lower high (LH) while the oscillator makes a higher high (HH) – a bearish hidden divergence. In practice, hidden divergence tells you that the prevailing trend still has momentum, even though price temporarily retraces.
Key points for hidden divergence
Below is a concise, rule‑based approach that you can apply to any crypto pair.
| Step | Action | Reason |
|---|---|---|
| 1 | Identify divergence (regular or hidden) on the chosen timeframe. | Sets the premise of the trade. |
| 2 | Wait for a confirming candlestick pattern (engulfing, pin bar, or hammer). | Reduces false entries caused by oscillator lag. |
| 3 | Enter at the close of the confirming candle. | Provides a clear entry price. |
| 4 | Place the stop‑loss just beyond the most recent swing point (e.g., below the low of a bullish hidden divergence). | Aligns risk with the structure of the chart. |
| 5 | Set a target of 1.5 × to 2 × the risk, or use the next major resistance/support level. | Keeps risk‑reward favorable. |
| 6 | Trail the stop‑loss using the ATR (14) once the trade moves in your favor. | Locks in profit while allowing the trend to run. |
Example: On the BTC/USD 4 H chart, price forms a higher low at $28,800 while the RSI makes a lower low at 45. A bullish hidden divergence is flagged. A bullish engulfing candle closes at $28,950. You enter long, set a stop‑loss at $28,600 (just below the swing low), and aim for a target near $30,200 – roughly a 2 × risk‑reward ratio. If the price reaches $29,600, move the stop‑loss to break‑even using the 14‑period ATR.
Even the best divergence signals can fail during high‑impact news or extreme volatility. Follow these risk‑management pillars:
When you’re working toward a Global4EX Challenge or a 1‑Phase evaluation, the rules often require a minimum number of winning trades and a low maximum drawdown. Divergence can help you meet those criteria:
When comparing the best prop firms in 2026, Global4EX stands out with flexible evaluation structures, low drawdown limits, and instant funding options that let you apply divergence strategies on a funded account from day one.
Divergence—both regular and hidden—remains a timeless tool in the technical‑analysis toolbox. By mastering the identification process, pairing it with solid candlestick confirmation, and applying disciplined risk management, you can turn these signals into a repeatable crypto trading strategy. Whether you trade a personal account or a Global4EX funded account, the principles stay the same: let the oscillator reveal the hidden story, and let the price confirm it.
Published by the Global4EX Team. Learn more at global4ex.com
Join Global4EX where traders unite, grow, and get rewards.
Join CommunityAll accounts provided by Global4EX are demo accounts operating exclusively in a simulated trading environment. No actual trades are executed on live financial markets. The services we offer are designed for educational and evaluation purposes only.
The simulated trading services are provided by Global4EX, operated by LOGIC GRATE SERVICES LTD. All content published and distributed by Global4EX and its related entities (collectively, the "Company") is for general informational purposes only.
The Company does not provide investment advice.
The Company does not solicit or recommend the purchase or sale of any financial instruments, securities, or funds.
The Company does not act as a broker, custodian, or financial intermediary.
Participation in any program is voluntary, and all fees paid to the Company are strictly service fees only.
Program fees:
are not deposits
do not represent client funds
are not investments
do not generate returns, interest, or profit
These fees are applied toward operational and administrative expenses, including platform infrastructure, technology, support services, and risk management systems. Payment of fees does not create any fiduciary, custodial, or investment relationship between participants and the Company. Participants should understand that such fees provide access only to simulated trading evaluations and related services in a demo environment. Nothing on this website or in our programs constitutes an offer to buy or sell futures, options, CFDs, forex, stocks, or any other financial instruments. All results displayed are based on simulated trading performance. Past simulated performance is not necessarily indicative of future results.
Trading financial markets involves a high level of risk. Even in a simulated environment, strategies and outcomes may not reflect real-world execution. Participants should carefully consider their experience, objectives, and risk tolerance before engaging in any trading-related activity.
The website https://global4ex.com is owned and operated by LOGIC GRATE SERVICES LTD, registered in United Kingdom (Company No. 16914973), with registered office at 5 Brayford Square, London, England E1 0S.
Global4EX © 2026 is a brand name of LOGIC GRATE SERVICES LTD.