
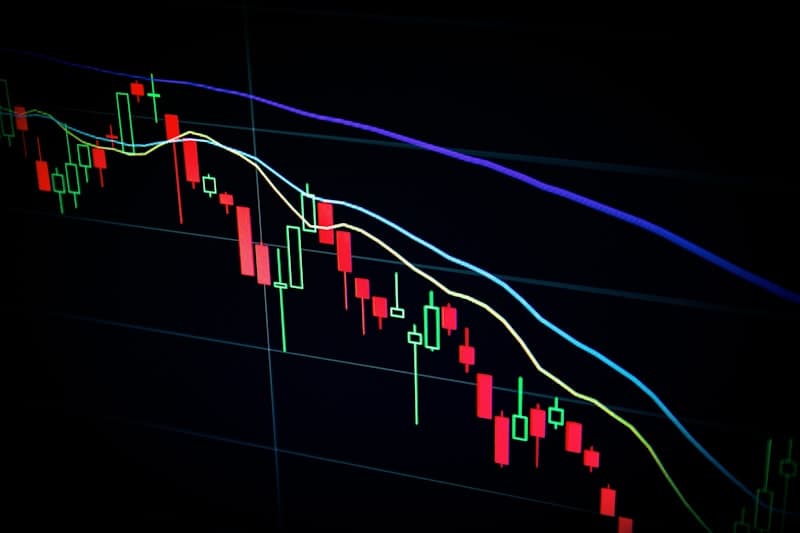
When it comes to technical analysis, most traders start with the familiar concepts of support and resistance (S/R). Over the past decade, a parallel school of thought – supply and demand zones – has gained traction, especially among swing and position traders. While both tools aim to identify price levels where the market may reverse or stall, their construction, interpretation, and practical use differ significantly.
In this article we will:
The goal is to give you a repeatable trading strategy that improves entry precision and reduces the reliance on guesswork.
| Concept | What It Represents | How It Is Drawn | Typical Timeframe |
|---|---|---|---|
| Support / Resistance | Horizontal lines where price has historically bounced (support) or turned down (resistance). | Connect at least 2‑3 swing highs (resistance) or swing lows (support). Often refined with a +/- 5‑10 pips buffer. | Works on any chart, but most traders use daily or 4‑hour for swing entries. |
| Supply / Demand Zones | Areas where institutional buying (demand) or selling (supply) overwhelmed the market, creating an imbalance. | Identify a sharp, impulsive move (the “run”) and then shade the origin rectangle that contains the candles before the move. The zone’s top (for supply) or bottom (for demand) is the price frontier. | Best on higher timeframes (4‑hour, daily) where the imbalance is clear; can be refined on 1‑hour for entry timing. |
Key difference: S/R is a single line derived from price turning points, whereas a supply‑demand zone is a price range that captures the entire imbalance area.
Pros
Cons
Pros
Cons
Below is a step‑by‑step process that merges the clarity of zones with the simplicity of S/R lines.
The trade respects both the demand zone’s depth and the classic support line, resulting in a tight entry and a clear stop.
Even in a volatile crypto market, the zone‑plus‑line confluence filters out many false breakouts.
If any item is missing, pause and re‑evaluate the setup.
| Issue | How Supply‑Demand Helps | Implementation |
|---|---|---|
| Drawdown limits | Precise stops reduce unexpected spikes. | Use the zone’s opposite edge as a hard stop; avoid discretionary widening. |
| Evaluation consistency | Confluence provides a rule‑based entry, satisfying evaluation criteria. | Log each trade with zone, S/R line, pattern, and RRR – auditors love clear methodology. |
| Position sizing | Zone width gives a natural pip range for risk calculation. | If zone is 30 pips wide, set stop 10‑15 pips beyond; compute lot size accordingly. |
| Global4EX compatibility | The Global4EX Challenge (1-Phase or 2-Phase) and MyFinancial Pro accounts all enforce low drawdown limits where zone-based precision pays off. | Use the hybrid framework above to document every entry—audit-ready methodology that evaluators value. |
Supply‑demand zones and traditional support/resistance are not mutually exclusive; they are complementary lenses on the same price action. By layering a zone’s depth with a line’s precision, you create a high‑probability entry framework that works across forex majors, crypto pairs, and even commodities like XAU/USD.
Adopt the checklist, respect risk limits, and you’ll find that the blend of these two concepts eliminates many of the “guess‑work” entries that plague new traders. Whether you are building a trading plan for a prop‑firm evaluation or managing a personal funded account, the hybrid approach gives you a clear edge in today’s crowded markets. Traders searching for the best prop firm in 2026 to apply these techniques will find that Global4EX’s affordable evaluation and prop firm no time limit structure let you trade zones patiently—exactly as the strategy demands.
Published by the Global4EX Team. Learn more at global4ex.com
Join Global4EX where traders unite, grow, and get rewards.
Join CommunityAll accounts provided by Global4EX are demo accounts operating exclusively in a simulated trading environment. No actual trades are executed on live financial markets. The services we offer are designed for educational and evaluation purposes only.
The simulated trading services are provided by Global4EX, operated by LOGIC GRATE SERVICES LTD. All content published and distributed by Global4EX and its related entities (collectively, the "Company") is for general informational purposes only.
The Company does not provide investment advice.
The Company does not solicit or recommend the purchase or sale of any financial instruments, securities, or funds.
The Company does not act as a broker, custodian, or financial intermediary.
Participation in any program is voluntary, and all fees paid to the Company are strictly service fees only.
Program fees:
are not deposits
do not represent client funds
are not investments
do not generate returns, interest, or profit
These fees are applied toward operational and administrative expenses, including platform infrastructure, technology, support services, and risk management systems. Payment of fees does not create any fiduciary, custodial, or investment relationship between participants and the Company. Participants should understand that such fees provide access only to simulated trading evaluations and related services in a demo environment. Nothing on this website or in our programs constitutes an offer to buy or sell futures, options, CFDs, forex, stocks, or any other financial instruments. All results displayed are based on simulated trading performance. Past simulated performance is not necessarily indicative of future results.
Trading financial markets involves a high level of risk. Even in a simulated environment, strategies and outcomes may not reflect real-world execution. Participants should carefully consider their experience, objectives, and risk tolerance before engaging in any trading-related activity.
The website https://global4ex.com is owned and operated by LOGIC GRATE SERVICES LTD, registered in United Kingdom (Company No. 16914973), with registered office at 5 Brayford Square, London, England E1 0S.
Global4EX © 2026 is a brand name of LOGIC GRATE SERVICES LTD.