
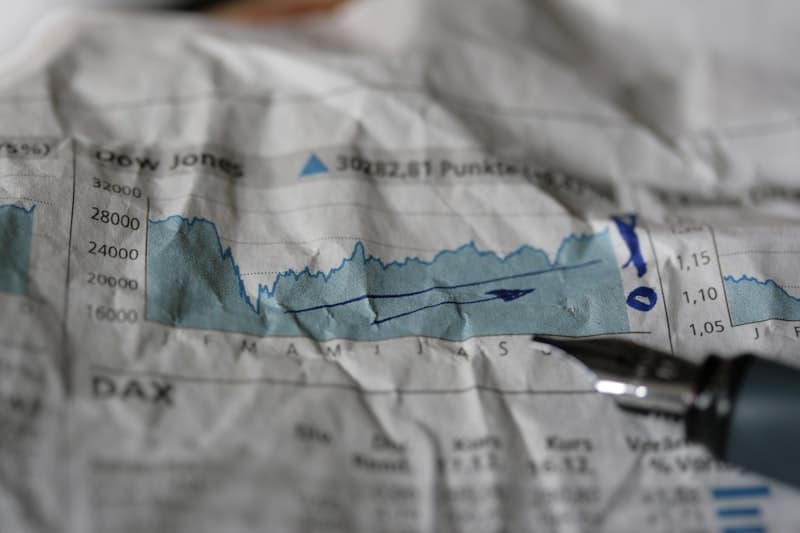
Trendlines are a staple of technical analysis for both forex trading and crypto trading. When drawn correctly, they highlight the market’s underlying direction and reveal key support and resistance zones. Unfortunately, many traders—especially those new to prop firm evaluations—misplace or misinterpret these lines, leading to false breakouts, unnecessary drawdowns, and missed profit opportunities.
In this guide we’ll dissect seven common trendline drawing mistakes and provide concrete examples using EUR/USD, GBP/USD, and BTC/USD. By the end you’ll have a practical checklist that you can apply whether you trade a personal account or a Global4EX funded account.
Mistake: Drawing a daily‑chart trendline for a 5‑minute scalping strategy.
Why it hurts: Higher‑timeframe trendlines are smoother and capture long‑term sentiment, while lower‑timeframe price action is noisy. Applying a daily line to a 5‑minute chart creates a support level that the market repeatedly pierces, causing premature exits and inflated drawdown.
Example: On the EUR/USD 5‑minute chart (April 2024), a daily‑trendline drawn from the March 15 low to the March 22 high appears as a strong support line. In reality, the 5‑minute price bounced off a much tighter intraday trendline drawn from the March 21 low to the March 23 high, resulting in a cleaner entry.
Takeaway: Match the timeframe of the trendline to your intended trading strategy. Day‑traders should use 1‑hour or 4‑hour charts; scalpers stick to 5‑minute or 15‑minute charts.
Mistake: Declaring a line a trendline after only two touches.
Why it hurts: Two points can always be connected, but they rarely represent a genuine market consensus. A line with three or more distinct touches is statistically more reliable.
Example: GBP/USD on the 4‑hour chart in June 2024 formed a descending channel. The line from the June 5 high to the June 12 low only touched twice. A third touch on June 19 confirmed the resistance, and the price respected it thereafter. Traders who ignored the third touch entered on a false breakout and saw the price reverse.
Takeaway: Require at least three touches (or a clear bounce) before treating a line as valid support or resistance.
Mistake: Mixing swing highs of different magnitudes—using a minor peak next to a major swing.
Why it hurts: Trendlines built on uneven swing points become slanted incorrectly, causing the line to cut through the price action rather than sit along it.
Example: On the BTC/USD daily chart, a trader connected the March 1 high (a modest rally) with the March 15 low (a sharp drop). The resulting line sloped upward, but the price kept falling below it, making the “support” invalid. When the proper major swing high on March 10 was used instead, the line correctly identified a resistance zone.
Takeaway: Use swing points of comparable significance—preferably the highest high and lowest low within the same swing structure.
Mistake: Drawing a short line that ends before the next price action.
Why it hurts: A truncated line gives a false sense of security; the market may appear to respect the line simply because the line is not present where the price actually tests it.
Example: A trader plotted a trendline on EUR/USD from the February 10 low to the February 20 high but stopped the line at February 22. The price later retested the same level on March 5, but the line had already ended, leading the trader to miss the bounce.
Takeaway: Extend trendlines well beyond the last touch—typically at least one to two bars (or candles) beyond the most recent price action.
Mistake: Trying to fit a single trendline over a complex, multi‑wave structure.
Why it hurts: Markets often move in waves (impulse, corrective, impulse). A line that spans several waves will be too flat or too steep, failing to represent any specific wave’s support/resistance.
Example: In the GBP/USD 1‑hour chart, a trader drew a line from the January 2 low to the January 15 high, encompassing three distinct impulse‑corrective cycles. The line was nearly horizontal, and price repeatedly broke it. Separate trendlines for each impulse wave provided clearer entry points.
Takeaway: Identify the current wave pattern and draw trendlines within that wave, not across multiple cycles.
Mistake: Relying solely on price points without confirming with volume or momentum indicators.
Why it hurts: A trendline may appear strong, but low volume or weak momentum can foreshadow a quick breach.
Example: On the BTC/USD 4‑hour chart, a descending trendline from the December 20 high to the January 5 low looked solid. However, the RSI was already in oversold territory and volume spiked on the next candle, leading to a sharp bounce that broke the line. Traders who ignored momentum entered short positions that were quickly reversed.
Takeaway: Pair trendlines with RSI, MACD, or volume cues to validate the strength of the support or resistance.
Mistake: Treating a trendline as immutable across major session changes or macro events.
Why it hurts: Liquidity shifts during the Asian‑London‑New York overlaps can cause temporary violations that are later re‑absorbed. Similarly, high‑impact news can produce spikes that invalidate a line temporarily.
Example: EUR/USD showed a strong support line on the 1‑hour chart during the Asian session. When the London open arrived, the price briefly slipped below the line due to a surge in order flow, only to rebound and respect the line again. Traders who set stop‑losses at the breach suffered unnecessary drawdown.
Takeaway: Incorporate session awareness and news calendars into your trendline analysis. Consider widening stop‑losses or using ATR‑based buffers during volatile periods.
If you are pursuing a Global4EX Challenge or a 2‑Phase evaluation, precision in technical analysis directly impacts your risk management and drawdown limits. Mis‑drawn trendlines can cause premature exits that erode your win‑rate, jeopardizing the funded account tier you aim for, such as MyFinancial Pro or MyFinancial Plus+.
When comparing the best prop firm 2026, look for flexible evaluation rules, fast payouts, and robust educational resources—exactly what Global4EX provides. By mastering trendline accuracy, you not only improve your trading strategy but also position yourself as a disciplined trader ready for the next level of prop firm success.
Trendlines are powerful, but only when drawn correctly. Avoid the seven pitfalls outlined above, apply the checklist, and test your lines with momentum and volume confirmation. Whether you trade EUR/USD, GBP/USD, BTC/USD, or any other instrument, precise support and resistance mapping will sharpen your entries, protect your capital, and boost your performance in both personal and Global4EX funded accounts.
Published by the Global4EX Team. Learn more at global4ex.com
Join Global4EX where traders unite, grow, and get rewards.
Join CommunityAll accounts provided by Global4EX are demo accounts operating exclusively in a simulated trading environment. No actual trades are executed on live financial markets. The services we offer are designed for educational and evaluation purposes only.
The simulated trading services are provided by Global4EX, operated by LOGIC GRATE SERVICES LTD. All content published and distributed by Global4EX and its related entities (collectively, the "Company") is for general informational purposes only.
The Company does not provide investment advice.
The Company does not solicit or recommend the purchase or sale of any financial instruments, securities, or funds.
The Company does not act as a broker, custodian, or financial intermediary.
Participation in any program is voluntary, and all fees paid to the Company are strictly service fees only.
Program fees:
are not deposits
do not represent client funds
are not investments
do not generate returns, interest, or profit
These fees are applied toward operational and administrative expenses, including platform infrastructure, technology, support services, and risk management systems. Payment of fees does not create any fiduciary, custodial, or investment relationship between participants and the Company. Participants should understand that such fees provide access only to simulated trading evaluations and related services in a demo environment. Nothing on this website or in our programs constitutes an offer to buy or sell futures, options, CFDs, forex, stocks, or any other financial instruments. All results displayed are based on simulated trading performance. Past simulated performance is not necessarily indicative of future results.
Trading financial markets involves a high level of risk. Even in a simulated environment, strategies and outcomes may not reflect real-world execution. Participants should carefully consider their experience, objectives, and risk tolerance before engaging in any trading-related activity.
The website https://global4ex.com is owned and operated by LOGIC GRATE SERVICES LTD, registered in United Kingdom (Company No. 16914973), with registered office at 5 Brayford Square, London, England E1 0S.
Global4EX © 2026 is a brand name of LOGIC GRATE SERVICES LTD.